Examples
This is the list of the different examples that shows how to use the affapy library. The examples 1 to 5 are inspired by the libaffa library which is a C++ Affine Arithmetic library.
Affine example: Basic usage of Affine module
Interval example: Basic usage of Interval module
Conversion example: Conversion between IA and AA
Precision example 1: Use of precision module with affapy
Precision example 2: Use of precision module with decorators
Example 1
A simple example of using the lib
This example is a simply way to use the affapy library.
Example 2
Time performances between AA and IA model
This example shows the time performances between AA and IA. It permorms calculations on the following function:
The result of this example is that AA is slower than IA.
Usage:
python3 example5.py [lbound1] [ubound1] [lbound2] [ubound2] [boxn]
lbound1: lower bound of the interval 1 (default: 10)
ubound1: upper bound of the interval 1 (default: 100)
lbound2: lower bound of the interval 2 (default: 10)
ubound2: upper bound of the interval 2 (default: 100)
boxn: number of boxes (default: 1000)
Example 3
Underflow demonstration
This example shows that with a little uncertainty, the model of AA can return a huge interval after calculations.
Example 4
Comparison AA vs IA
We consider the function:
We consider the interval [lbound, ubound] (default: [1, 6]) and a subdivision of this interval containing n boxes (default: 12). The function is evaluated for each box with AA and IA. The result is plotted using matplotlib.
Usage:
python3 example4.py [lbound] [ubound] [boxn]
lbound: lower bound of the interval (default: 1)
ubound: upper bound of the interval (default: 6)
boxn: number of boxes (default: 12)
You need to install matplotlib and numpy to run this example.
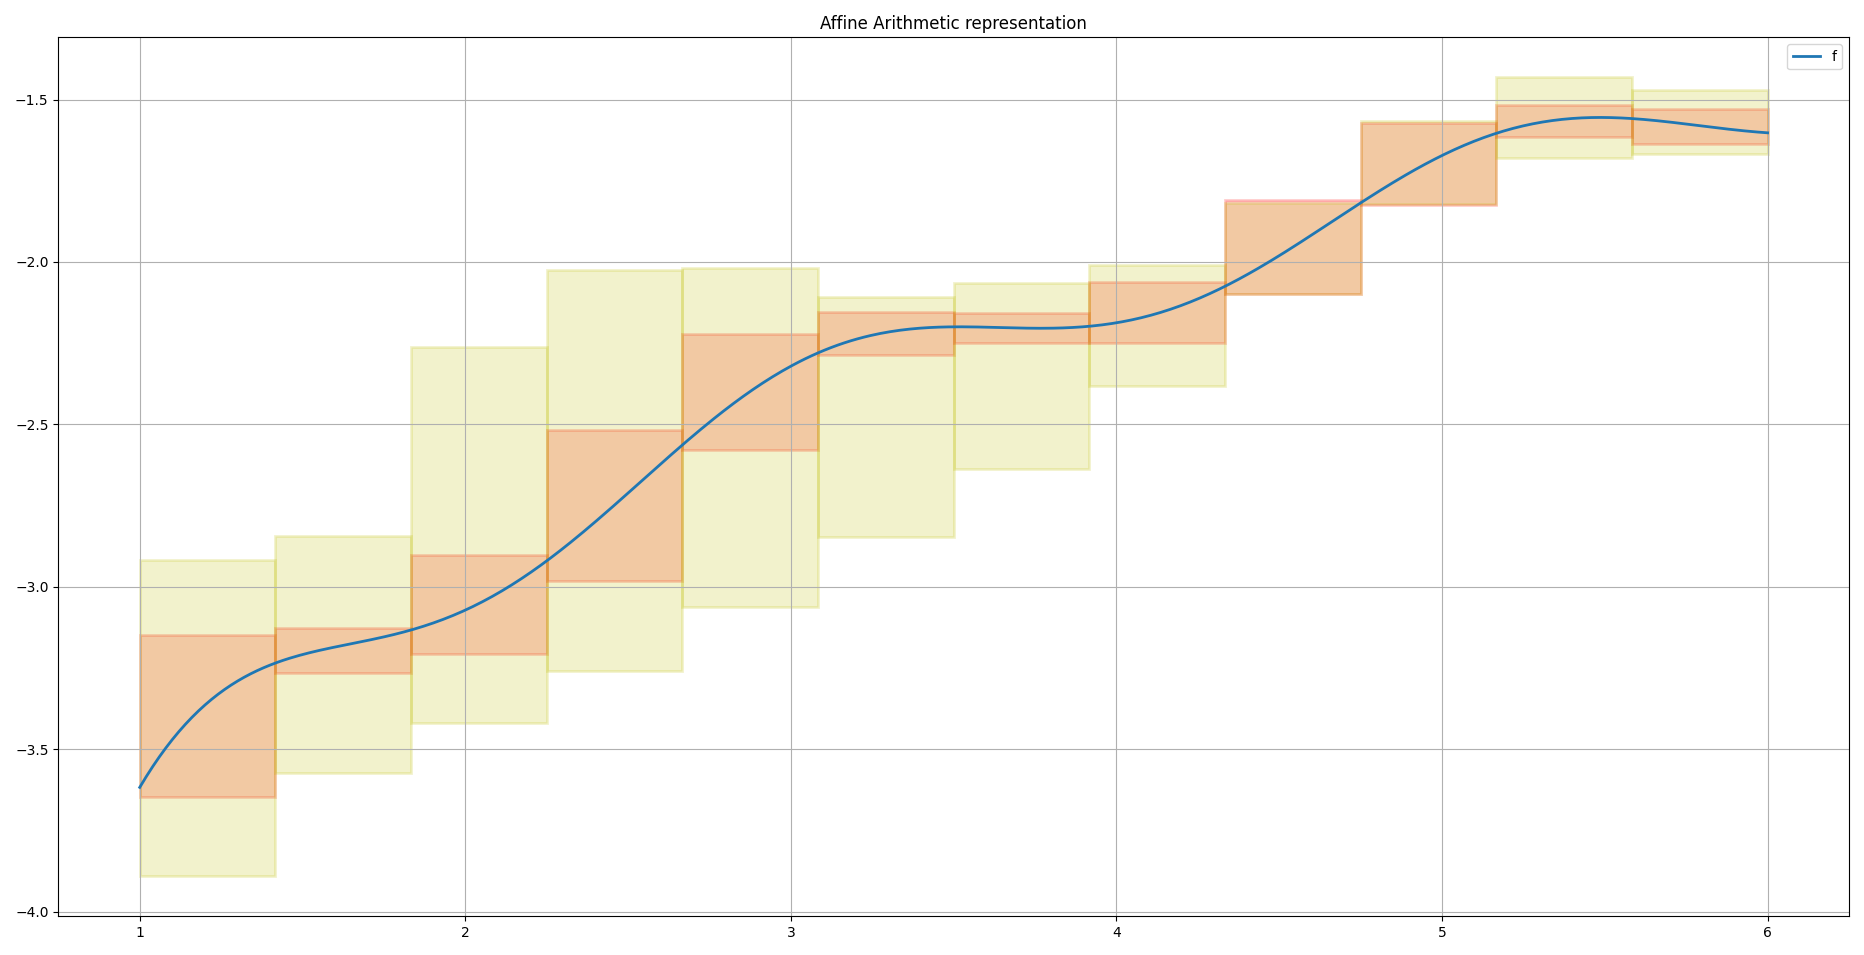
Output of example 4:
in blue: the function
in yellow: IA
in orange: AA
Example 5
Comparison AA vs IA
We consider the function:
We consider the interval [lbound, ubound] (default: [0, 5]) and a subdivision of this interval containing n boxes (default: 60). The function is evaluated for each box with AA and IA. The result is plotted using matplotlib.
Usage:
python3 example5.py [lbound] [ubound] [boxn]
lbound: lower bound of the interval (default: 0)
ubound: upper bound of the interval (default: 5)
boxn: number of boxes (default: 60)
You need to install matplotlib and numpy to run this example.
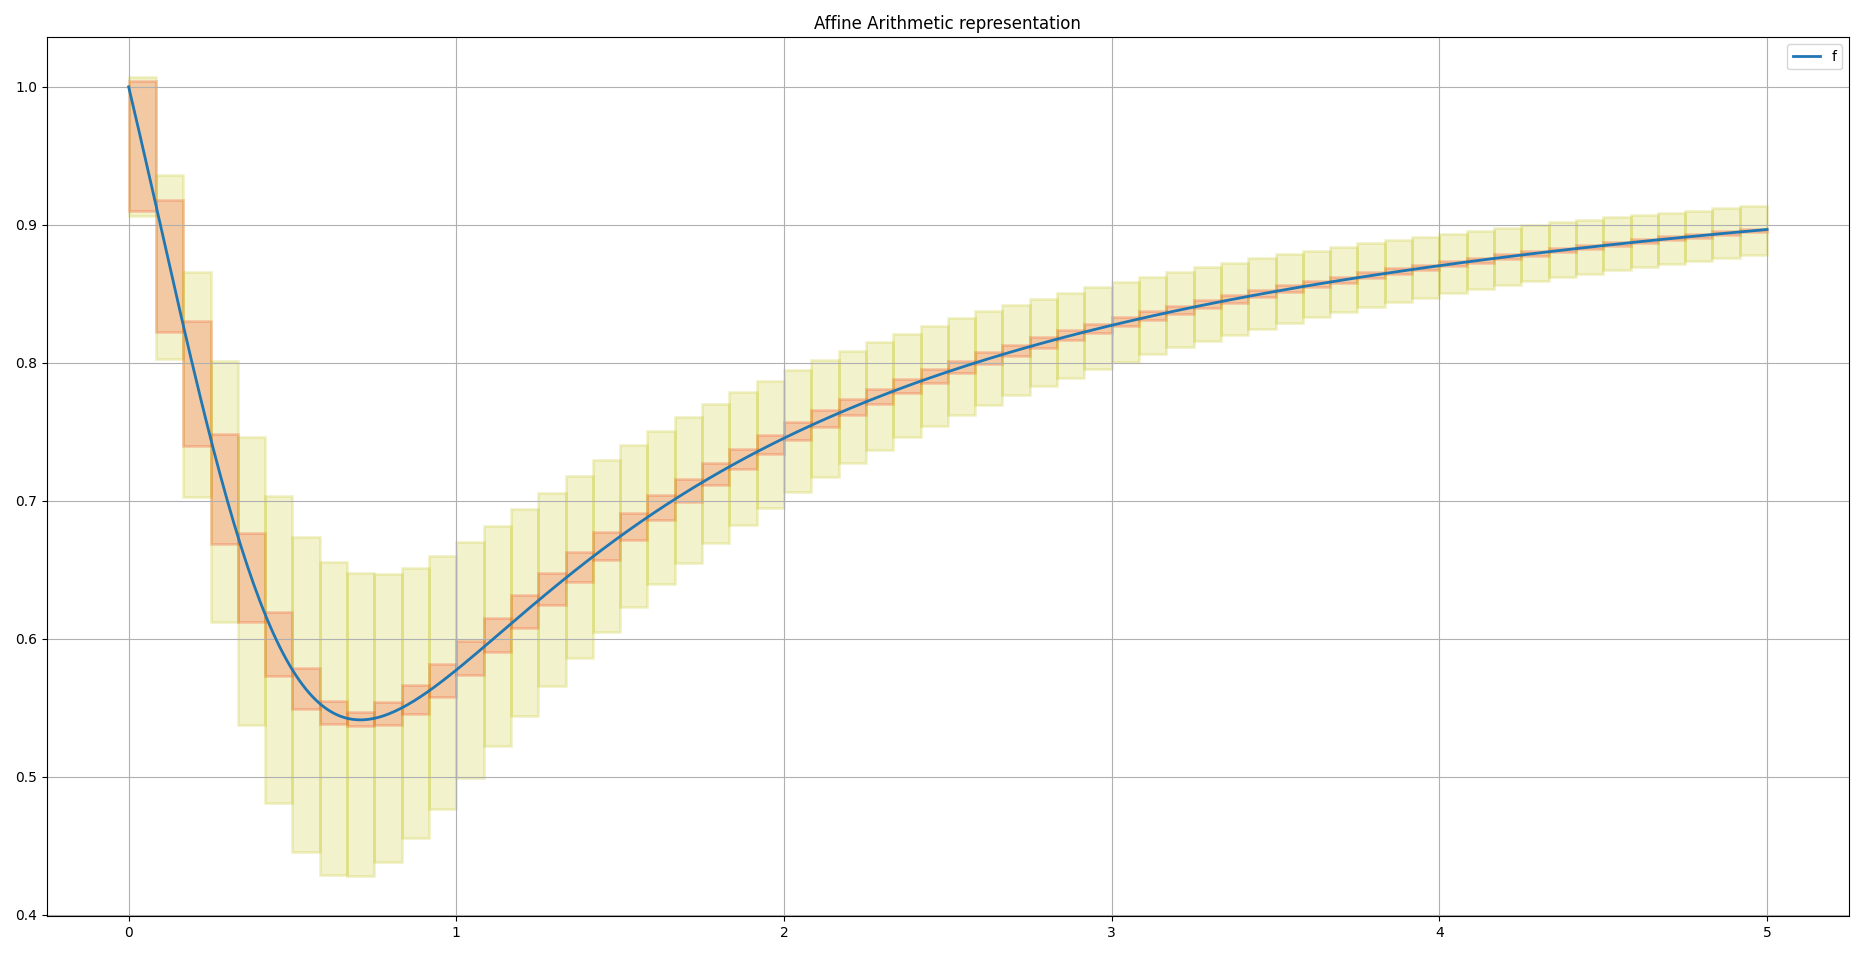
Output of example 5:
in blue: the function
in yellow: IA
in orange: AA